Today we made a blissful hike up to the snout (an alternative term for the terminus) of the Morterartsch glacier near Pontresina, Switerland. Our mission for the day was to perform several ecological surveys based on the concept of space-for-time. When applied to glaciers, this concept allows us to observe the space and conditions where the glacier was in 1880 then broadly apply our observations of that the area to the newly exposed regions of the valley to predict what it may look like in 140 years. The survey categorized the types of vegetation present, if any, and their percent coverage in semi-randomly selected 25 km2 quadrant. Although the data was certainly not without confounding variables and imperfect methodology, we were able to observe some general trends. For example, following the retreat of the glacier, it takes a while for trees and the ground cover that accompany them (mosses, grasses, etc) to develop because the ground left behind immediately after the recession of the glacier does not contain the necessary organic matter. During some of our earlier hikes in the course, we had noticed some of the vegetation patterns around glacial regions, but it was really cool to actually get a more thorough grasp on the concepts that Jeff had presented to us in snippets. It was also somewhat heartening to see that, although the glaciers are beautiful wild things we should try to save, when they are gone they do leave behind the gift of a myriad wildflower meadows, threaded with streams and shadowed by the canopy of conifers.
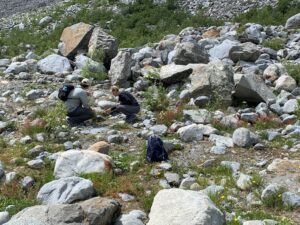
Students surveying in the 2000 sector
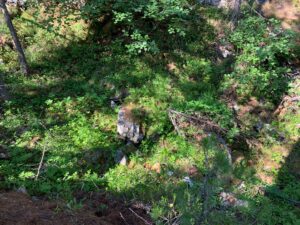
Quadrat from the 1857 sector of the survey
We took lunch by the former moraine of the glacier, a safe viewing distance away from the constant rock falls that plague slopes where ice has recently receded rapidly. The glacial regions we have seen thus far have had associated risks, but are usually perfectly peaceful, making it easy to forget how rapidly the ice is really disappearing and the consequences that can have for the stability of the underlying land. However, the continuous clack-clack-click-thump of rocks falling down icy slopes served to remind us that change is happening. On the way back down the trail, we did another small scale survey to mark that change. As the trail progresses up to the glacier, there are markers stating the date at which the glacier reached that location. Using a GPS from Jeff’s Bottomless Bag of Many Things, we took the coordinates of each location to determine the exact distance between markers. With these measurements we were able to calculate and plot the approximate yearly loss of ice from 1860 to the present.
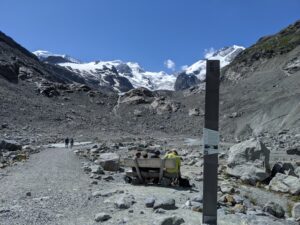
Post marker indicating the tongue of the glacier in 2015
The plot generated was not quite what we expected to see. There was a lot of variation in loss, with some 20 year spans in which almost no ice was lost or very little was lost relative to other points on the graph. However, in the context of glacial science, it started to make a lot more sense. Overall, glaciers are a pretty good representation of the climate, but there are lots of factors that can affect the correlation between variables. For example, if there is a lot of snow one year and the summer is relatively mild, a glacier could stop retreating or even advance despite climate change. This is something that can been seen fairly frequently in maritime and Antarctic glaciers where climate change has worked to increase the precipitation because the warming atmosphere has a greater carrying capacity for water vapor. So folks, if you ever hear someone say that climate change isn’t real because some glaciers are advancing, they’re extra wrong!
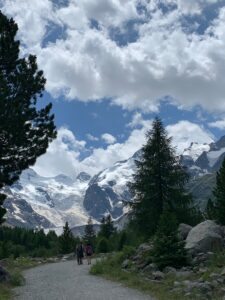
View of the glacier covered mountains from the path